

In the world of web development, data visualization plays a pivotal role in conveying information to users in a clear and interactive manner. Charts are a powerful tool for visualizing data trends, patterns, and insights, and ReactJS, a popular JavaScript library, provides an excellent platform to integrate these charts seamlessly into your web applications. In this article, we’ll explore the importance of data visualization, the benefits of using charts, and how to effectively implement various types of charts in a ReactJS application.
The Importance of Data Visualization
Data visualization is a crucial aspect of conveying complex information to users in a comprehensible and engaging manner. It allows users to quickly grasp insights from large datasets and aids in making informed decisions. Well-designed visualizations enhance user experience, improve data understanding, and highlight trends that might not be apparent from raw data alone.
Benefits of Using Charts
Charts offer a multitude of benefits when it comes to displaying data:
- Clarity: Charts distill complex data into easy-to-understand visuals, reducing cognitive load and helping users understand information faster.
- Comparison: Different types of charts allow users to compare data points easily, making it simpler to identify trends and patterns.
- Trends and Patterns: Charts enable the identification of trends and patterns that might not be evident from a simple data table.
- Interactivity: Interactive charts empower users to explore data on their terms, enhancing engagement and providing a more personalized experience.
- Storytelling: Charts can help tell a story by illustrating data-driven narratives, making presentations and reports more compelling.
Integrating Charts in ReactJS
ReactJS is widely used for building dynamic and interactive web applications. Integrating charts into a ReactJS application can be achieved using various third-party libraries. Here, we’ll explore how to use the popular charting library, react-chartjs-2, as an example.
Prerequisites
Before you begin, make sure you have the following:
- Node.js and npm (Node Package Manager) are installed on your computer.
- A basic understanding of ReactJS concepts.
- A text editor or integrated development environment (IDE) for coding.
Create a React Project
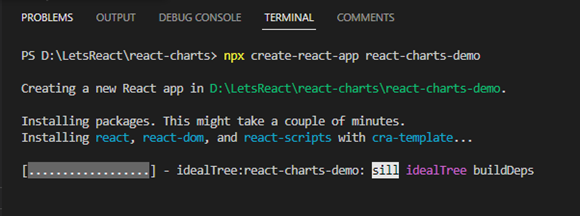
If you don’t have a React project set up, you can create one using create-react-app, a tool that sets up a new React project with a basic structure. Open your terminal and run the following commands:
npx create-react-app react-charts-demo
cd react-charts-demo
npm start
This will create a new React application and start the development server. You can access the application at http://localhost:3000.
Install react-chartjs-2
In your project directory, install the react-chartjs-2 library and its dependency, chart.js, using npm:
npm install react-chartjs-2 chart.jsCreate a Simple Bar Chart
Let’s start by creating a simple bar chart to display some data. Open the src directory of your project and create a new component named BarChart.js. In this component, you’ll use the Bar component from the react-chartjs-2 library.
// src/BarChart.js
import React from "react";
import { Bar } from "react-chartjs-2";

const labels = ["January", "February", "March", "April", "May"];

const BarChart = () => {
  const data = {
    labels,
    datasets: [
      {
        label: "Dataset 1",
        data: [100, 200, 150, 300, 250],
        backgroundColor: "rgba(234, 114, 126, 0.8)",
      },
      {
        label: "Dataset 2",
        data: [100, 200, 150, 300, 250],
        backgroundColor: "rgba(48, 192, 140, 0.8)",
      },
    ],
  };

  const options = {
    responsive: true,
    plugins: {
      legend: {
        position: "top",
      },
      title: {
        display: true,
        text: "Chart.js Bar Chart",
      },
    },
  };

  return (
    <div>
      <Bar options={options} data={data} />
    </div>
  );
};

export default BarChart;
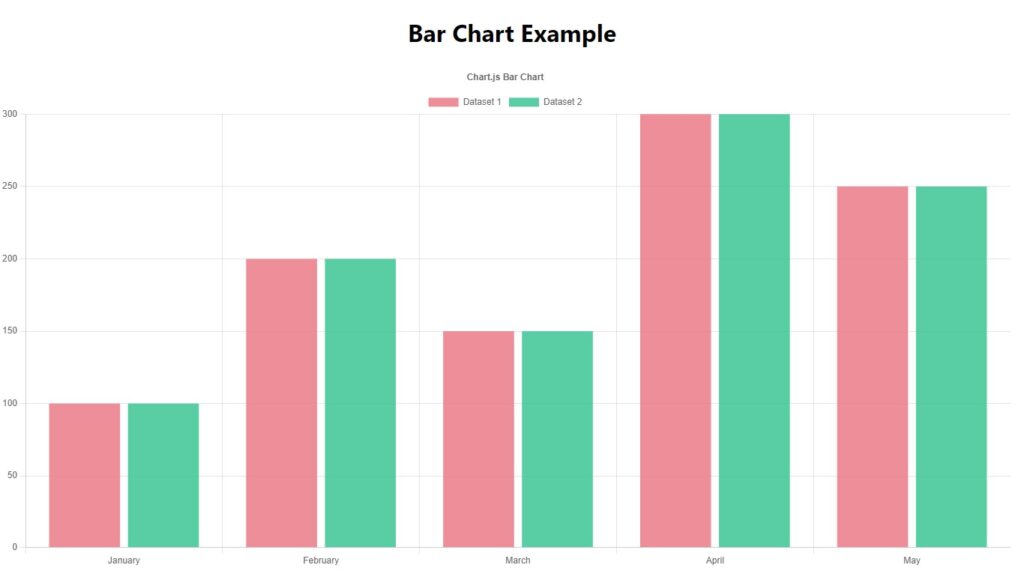
This example demonstrates a simple bar chart using react-chartjs-2. You can customize the chart’s appearance, labels, colors, and more according to your requirements.
The output would look as shown in the image below:
Styling and Customization
You can customize the appearance of your chart by modifying the data and options objects in the BarChart component. The data object contains labels and datasets, while the options object allows you to configure various aspects of the chart, such as scales and tooltips.
Create a Line chart
Here’s an example of how to create a line chart using the react-chartjs-2 library in a ReactJS application:
Create a new component named LineChart.js in your project’s src directory.
import React from "react";
import { Line } from "react-chartjs-2";

const LineChart = () => {
  const data = {
    labels: ["January", "February", "March", "April", "May"],
    datasets: [
      {
        label: "Sales",
        data: [100, 200, 150, 100, 250],
        borderColor: "rgba(234, 114, 126, 0.8)",
        borderWidth: 2,
        fill: false,
      },
      {
        label: "Sales",
        data: [150, 170, 100, 260, 150],
        borderColor: "rgba(48, 192, 140, 0.8)",
        borderWidth: 2,
        fill: false,
      },
    ],
  };

  const options = {
    scales: {
      y: {
        beginAtZero: true,
      },
    },
  };

  return (
    <div>
      <Line data={data} options={options} />
    </div>
  );
};

export default LineChart;
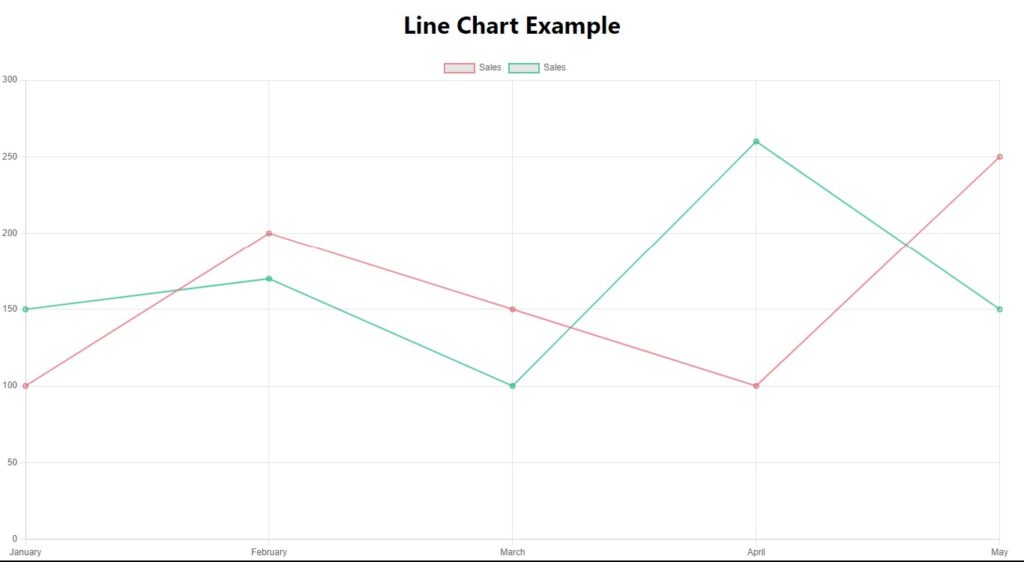
The output would look as shown in the image below:
Using the Chart Component
Now that you’ve created the BarChart component and LineChart component, you can use it in your main App.js file to display the chart. Import the BarChart component and LineChart component and also include it within the App component.
// src/App.js
import logo from "./logo.svg";
import "./App.css";
import BarChart from "./BarChart";
import LineChart from "./LineChart";
import {
  Chart as ChartJS,
  CategoryScale,
  LinearScale,
  BarElement,
  Title,
  Tooltip,
  Legend,
  PointElement,
  LineElement,
} from "chart.js";

ChartJS.register(
  CategoryScale,
  LinearScale,
  BarElement,
  Title,
  Tooltip,
  Legend,
  PointElement,
  LineElement
);

function App() {
  return (
    <div className="App">
      <div>
        <h1>Bar Chart Example</h1>
        <BarChart />
      </div>
      <div>
        <h1>Line Chart Example</h1>
        <LineChart />
      </div>
    </div>
  );
}

export default App;
Customize and Explore
You can customize the line chart by modifying the data and options objects in the LineChart component. The data object contains labels and datasets, while the options object allows you to configure scales, tooltips, colors, and more.
Remember to style your components using CSS to ensure they fit into the overall design of your application.
By following these steps and understanding how the data and options objects work, you can create various types of charts, including line charts, in your ReactJS application. The react-chartjs-2 library provides extensive documentation with examples for further exploration and customization.
Conclusion
Integrating charts into your ReactJS application can provide valuable insights and enhance user experiences. By following these steps and exploring the react-chartjs-2 documentation, you’ll be able to create various types of charts and tailor them to your specific needs. Whether you’re building analytics dashboards, data-driven applications, or interactive reports, ReactJS and react-chartjs-2 make data visualization a seamless and enjoyable process.
![]()